Posted: December 19, 2016, 4:53pm
I decided to throw together a quick visualization of the music I’ve been listening to for the past few years. Spotify has a tradition of sending its users their top 100 songs at the end of each year. I was curious if there would be any trends in my data, now that I’ve been a Spotify subscriber for two years (2015 and 2016).
Persistence of Song
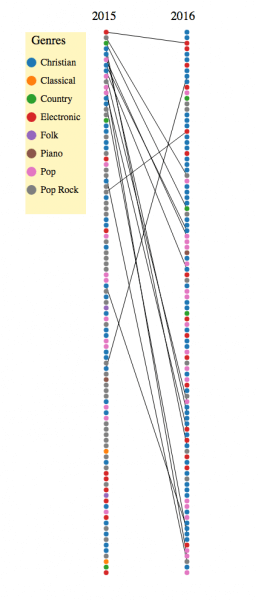
Only 16 songs persisted from year to year. I was curious if there would be a trend. Would I generally get tired of songs and thereby rank them lower in my estimation (and subsequently listen to them less often) the next year? It looks to be a general trend downward, yes. Only two songs increased in popularity. My top song in 2015 (an epic electronic song called “Something New”) only dropped to third place in 2016 though.
Embarrassing Data Points
I may regret posting this data publicly, so I may as well give you a head start on how to make fun of me. I remember being embarrassed by how high “Lovin’ So Hard” reached in 2015 (number 6), but hey, that song is just plain catchy. It made its reappearance at number 38 in 2016.
The only other embarrassment I have is how little Celine Dion appears on either list. C’mon Jeffrey.
Music Discovery
Spotify is honestly so great for music discovery, allowing you to follow artists or curated playlists for moods or genres. I noticed that much of my top 100 is consistent with bands that I discovered that year. In 2016 my most popular bands were Keith & Kristyn Getty (going from to 1 song in 2015 to 5 in 2016) and Matt Boswell (going from 1 song in 2015 to 6 in 2016)
Do you want to discover some of the songs I’ve been listening to? Click on any of the circles to be re-directed to Spotify’s online web player and give it a listen!
Here’s the chart. Click for an interactive version on my website!


