


When I was a teenager, I used to play a lot of strategy games and Role-Playing Games (RPG) with friends, like Age of Empires or Diablo 2: Lord of Destruction. Good times. However, the game I loved the most was not even a video game it is a trading-card game, called Magic The Gathering (MTG), which combines RPG and strategy.
There are a variety of formats, when it comes to playing Magics. The most famous is the so-called Constructed, where two players construct their own decks of 60 cards, and play against each other. Each game represents a battle, and by employing the use of creatures, instants, sorceries among other types of spells, they try to kill their opponents. The rules are quite complicated, and takes a long time to understand them all, but it is worth it. Besides, each year 3 expansion sets are usually released, so it is constantly updated. Such a complexity, makes the game really entertaining, totally unpredictable, and fun to watch, a perfect combination to make it a hit.
There are three main ways of getting cards to build your own deck: trading cards with other players, buying cards separately to suppliers, or buying boosters. A booster contains 15 cards, with 11 common cards, 3 uncommon cards, and 1 rare card. The rarer the card the better it is, and also the more expensive it is.
—
Last week, a friend of mine said that it would be a good idea to buy a booster box, which contains 36 boosters, open them all, and sell the cards separately. Rapidly, two important questions came up: (1) Is it worth it to buy a booster box and sell cards separately?; (2) Supposing that we buy only one booster box, which booster box should we buy in order to maximize the revenue?
They seemed silly questions that could be solved rapidly by asking to a friend that we all now have: Google. But as a data scientist, I found this problem really interesting and decided to give it a deeper look. In this post I will show you the study that I have performed in order to figure out what expansion is the one that gives the maximum revenue. You can follow along by taking a look at the notebook on my github.
Before starting, I decided to focus only in the last 6 sets released by MTG, since they are the ones that can be best sold in the near future. The six sets are the following ones, along with their abbreviations:
- Core Set 2019: m19.
- Ixalan: xln.
- Hours of Devastation: hou.
- Amonkhet: akh.
- Rivals of Ixalan: rix.
- Dominaria: dom.
The first and most important thing to do is to get the necessary data for the analysis. In particular, it is necessary to gather information about all the cards available in each expansion set, like the cards’ name, rarity, and, of course, price. Fortunately, there is an API, which is constantly updated, provided by Scryfall. With this API it is possible to get all the features mentioned before, as well as many other card’s or set’s features. In particular, the price given by Scryfall is in Euros, and it is the lowest price obtained from Scryfall’s affiliates.
After retrieving all the mentioned data, we obtain a table like this one.
| name | price | rarity | set | rarity_norm | |
| 0 | Abnormal Endurance | 0.05 | common | m19 | common |
| 1 | Act of Treason | 0.03 | common | m19 | common |
| 2 | Aegis of the Heavens | 0.06 | uncommon | m19 | uncommon |
| 3 | Aerial Engineer | 0.05 | uncommon | m19 | uncommon |
| 4 | Aethershield Artificer | 0.05 | uncommon | m19 | uncommon |
This all we need to move on to the following phase: sampling.
Sampling
In this section I am going to simulate opening several booster boxes, and see what is the revenue that we can be obtained by selling absolutely all the cards in it. In other words, it is as if we had the chance to open thousands of boxes, look at the cards we have obtained, sell them all, and take a note of how much we have earned from that sale. After that we take all the revenue amounts, and aggregate the results using several statistics tools.
As mentioned before, each box has 36 boosters, and each booster has 1 rare card, 3 uncommon cards, and 11 common cards (it also has a basic land, but it is worth very little so we do not consider them for the analysis). The sampling follows this procedure:
For each set s:
  For sample = 1 to number of samples:
    For booster = 1 to 36:
      Randomly pick 1 rare card from set s
      Randomly pick 3 uncommon cards from set s
      Randomly pick 11 common cards from set s
      Sum total costs of the 15 cards obtained this way
      Store total costs of the 15 cards obtained this way
As a result of such sampling, I obtained the following results:
| m19 | xln | hou | akh | rix | dom | |
| mean | 50.159 | 78.893 | 49.669 | 51.373 | 61.812 | 53.030 |
| std | 4.520 | 14.608 | 4.300 | 3.951 | 7.365 | 5.624 |
| min | 37.160 | 48.690 | 37.550 | 41.870 | 43.280 | 35.620 |
| 25% | 47.040 | 68.430 | 46.675 | 48.612 | 56.460 | 49.275 |
| 50% | 49.985 | 77.295 | 49.400 | 51.200 | 61.590 | 52.780 |
| 75% | 53.105 | 88.078 | 52.662 | 53.930 | 66.463 | 56.802 |
| max | 67.470 | 139.850 | 63.090 | 66.220 | 85.190 | 74.320 |
Each column in the table represents a set, and each row represents the univariate stats used to compare each set. The mean tells us the expected revenue obtained from selling the cards separately, or, in other words, is the average revenue obtained from selling cards separately for a box of boosters. Focusing in this number, it is clear that the set that might give us the greatest revenue is xln.
The other important number to look at is the median, which separates the sample in two sets with the exact number of data points. That means, that at least 50% of the samples for dom might generate $52.78 or more. In that sense, again xln is the most convenient set, since the median is by far the largest among all sets.
In addition, it is important to see what are the minimum and maximum revenues which might be obtained from each set. If we check out the prices for the boxes to be bought, the only box which would give us some profit is xln, since its maximum sampled revenue is greater than the price to buy such box (approximately $80).
We can visualize all these descriptive statistics using a Box-Plot, which points out the three most used quantiles and also the outliers.
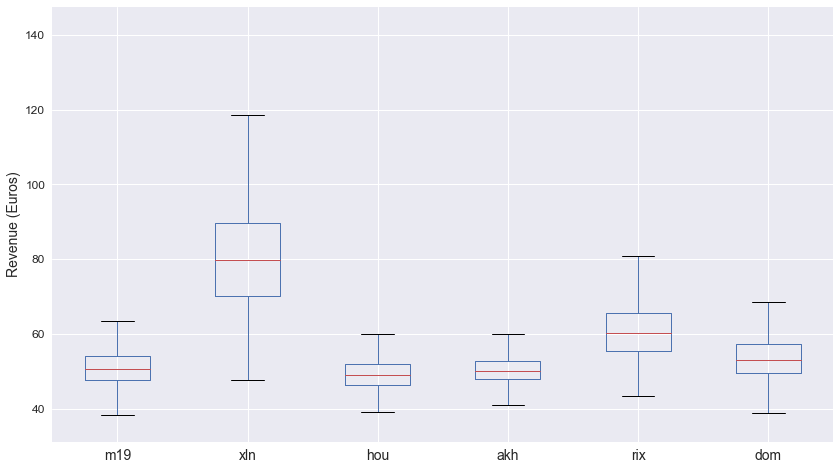
In this chart the red line represents the median, the line delimiting the box from below is the Q1 or 25% quantile, the line delimiting the box from above is the Q3 or 75% quantile. The lines below and above the box are set to 1.5*IQR, where IQR is the so-called Inter-Quantil Range, and shows how much the data extends to both sides of the half. Graphically, it is really easy to depict the difference between xln and the rest of the sets, with a median that is almost as large as the maximum values of rix.
Finally, let’s take a look at the distribution obtained from the sampling. It is usually important to understand the distribution, since it might be helpful for further studies (many statistical tests work on the assumption that the data distribution is Gaussian). To study the distribution, it is very helpful to watch a Histogram:
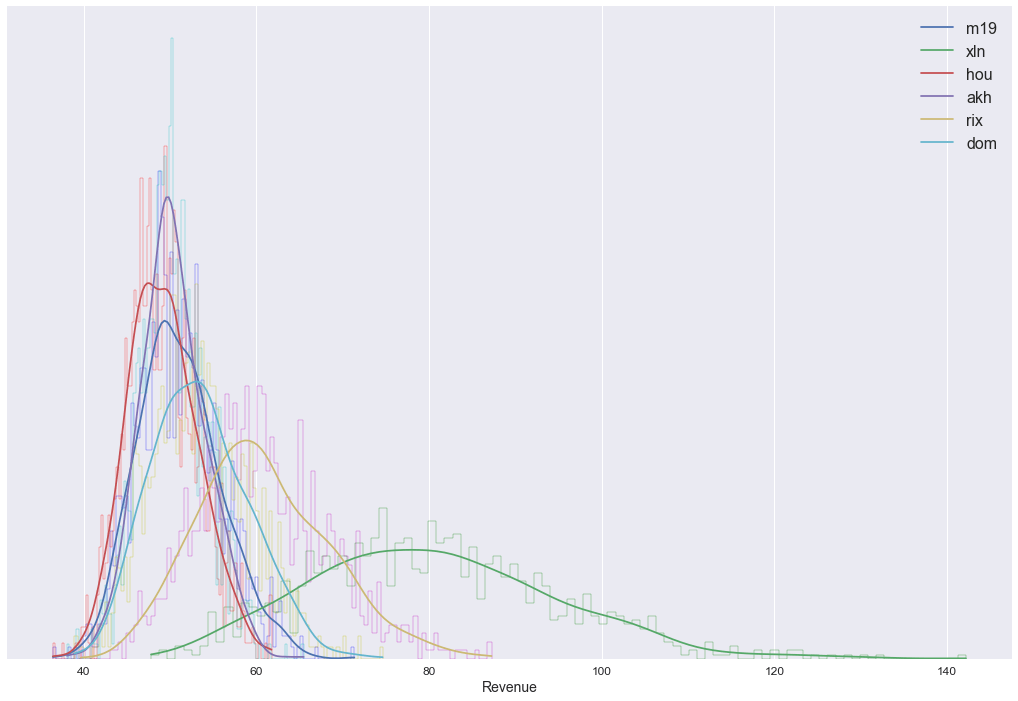
Basically, a histogram shows the number of samples that has a particular revenue, for example, there are many samples of xln with 80 dollars of revenue, compared to the number of samples with a revenue of 120.
Visually, they all seem Normal distributions, with the bell-shape form, even though there might be some skews on them. Again, it is possible to see that xln is a lot more profitable than the rest, since its mean is about $78, and is larger than the maximum revenue obtained from the rest of the sets. Besides, we can see that the minimum revenue obtained from that set is close to the average revenue of the rest of the sets.
Conclusion
From the analysis, we can claim that the expansion booster with the largest expected revenue is Ixalan. All the stats play in favor of it (median, max, min and mean). In further posts I will continue this analysis, and I will talk a little bit about statistical tests, I will compare the results obtained and make a claim based on some statistical confidence. Besides, I will talk about the Central Limit Theorem and its implications. Lastly, I will also take into account the card demands, because a card might be very expensive, but if there is nobody trying to buy it, then the analysis will be flawed.
Notes: I would like to point out that it is very hard / strange getting to sell exactly all cards of a booster box. But the goal of this post was to compare different sets, and all of them were given the same initial conditions, so the fact that not all the cards might be sold is not that relevant.
Published on August 9th, 2018Last updated on April 1st, 2021